rwthplots
Matplotlib style sheets, colormaps, and figure utilities for RWTH Aachen University's corporate design palette.


![]()
Developed at the Institute for High Voltage Equipment and Grids, Digitalization and Energy Economics (IAEW), RWTH Aachen University.
Gallery
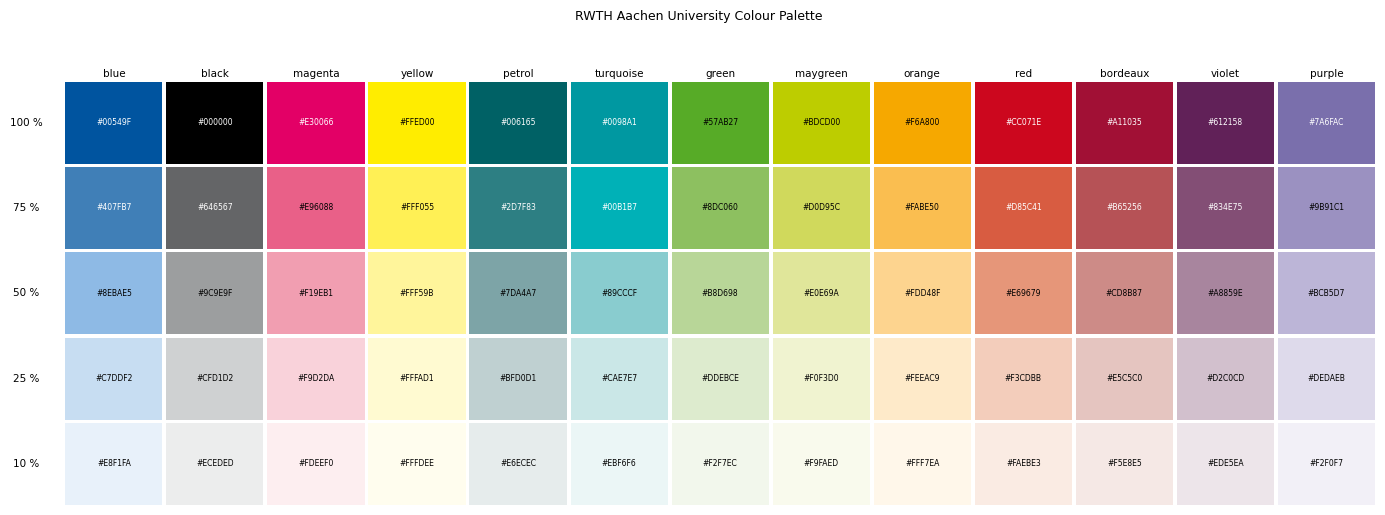
RWTH colour palette — 13 base colours × 5 tint levels
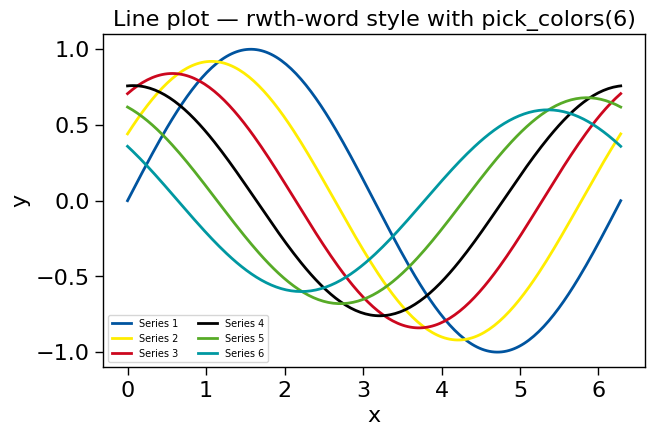
Line plot with context() and pick_colors(6)
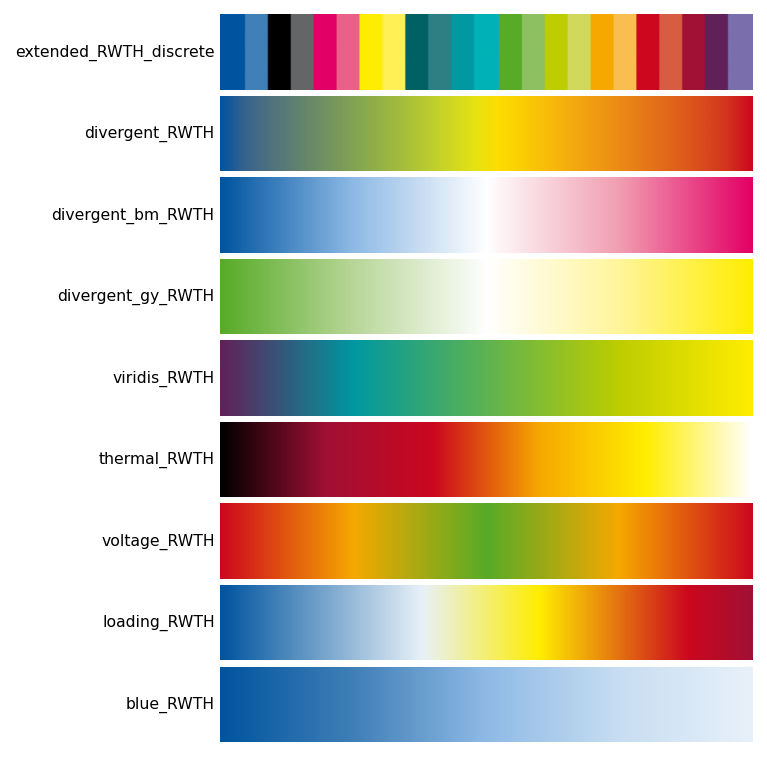
Colormaps — key maps overview
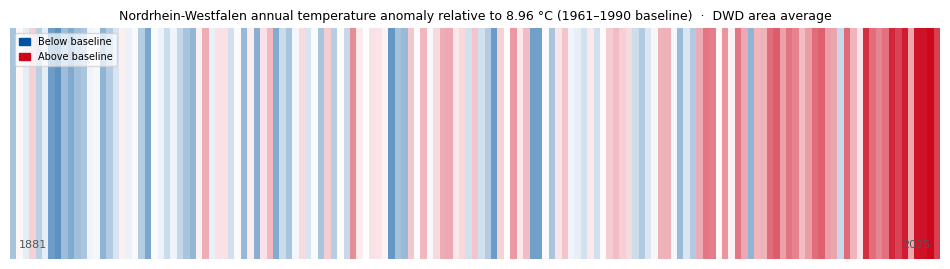
Climate stripes — Nordrhein-Westfalen 1881–2025, real DWD data
Why rwthplots?
Producing consistent, publication-ready figures in Python typically means
manually copying hex codes, tweaking rcParams for every new script, and
re-exporting at different sizes for different journals. rwthplots solves
this in a single import, built around the
RWTH Aachen University corporate design palette —
a carefully curated set of 13 base colours across 5 tint levels, designed for
contrast, legibility, and print reproduction.
import rwthplots
import matplotlib.pyplot as plt

with rwthplots.context("rwth-latex", "color.blue", "size.ieee-column"):
    fig, ax = plt.subplots()
    ax.plot(x, y)
    rwthplots.save_figure(fig, "results/fig1", formats=["pdf", "png"])
- One import registers all 38 colormaps (plus
_rreversed variants) and all style sheets. - Composable styles — stack a base style with colour, size, and journal modifiers without editing rcParams directly.
- Accessible by design —
pick_colors()selects maximally distinct colours in CIELAB;check_accessibility()flags confusable pairs under three types of colour vision deficiency. - Power-system ready — dedicated colormaps for voltage deviation and line
loading, plus a blackbody
thermal_RWTHmap.
Features at a glance
| Feature | Description |
|---|---|
| 6 base styles | LaTeX, Word, PowerPoint, dark, Beamer — drop-in plt.style.use() |
| Composable modifiers | 16 colour cycles · 6 misc tweaks · 6 journal presets · 15 size presets |
| 38 colormaps | Diverging, sequential, discrete, and power-system maps — plus _r reversed variants |
| Colour sets | Named qualitative palettes in HEX / RGB / normalised RGB |
| Accessibility | CVD simulation (Viénot-Brettel-Mollon), delta-E reporting, greedy pick_colors() |
| Figure sizing | set_size() with 15 journal/paper presets, golden-ratio height |
| Multi-format export | save_figure() writes PDF + PNG + SVG in one call |
Quick install
See Installation for full options and Quick Start for a tour of all features.